Construction of plant molecular phylogenetic trees
Phylogenetic analysis of plant molecules is mainly based on the use of biomolecular sequences (such as DNA sequences) that carry plant genetic information, and specific mathematical and statistical algorithms are used to construct phylogenetic relationships between plant species, and to summarize such relationships in the form of a branching tree, i.e., a phylogenetic tree. Phylogenetic trees can be divided into rooted and unrooted trees, with the former taking the outer taxa as the root and the latter having no outer taxa root. The rooted tree has the nearest common ancestor of all taxa and can reflect the phylogenetic relationships among taxa, while the unrooted tree only reflects the taxonomic relationships among taxa. Phylogenetic analysis of plants using DNA molecular sequences is a necessary tool for molecular evolutionary studies. The main methods for constructing phylogenetic trees are distance method, maximum parsimony method, maximum likelihood method, and Bayesian inference method. To solve the phylogenetic problems among specific plant taxa, it is necessary to first select reasonable taxa and DNA sequences to minimize the bias of the data, and then choose the appropriate tree construction method, followed by the evaluation of the results and biological explanations.
Operation method
Construction of plant molecular phylogenetic trees
Materials and Instruments
not have Move The basic process of constructing a plant molecular phylogenetic tree can be divided into the following steps: The distance method is a method of phylogenetic tree construction based on the evolutionary distance between species. The evolutionary distance between species generally depends on the genetic model; the best nucleic acid substitution model should be selected according to the evolutionary patterns of different DNA regions. Generally, the evolutionary distance can be estimated based on the nucleic acid substitution model (e.g., JC distance, Kimura distance, etc.) if codon concatenation is not taken into account and the substitution rate is assumed to be the same for all loci. Neighborjoining (NJ) in the distance method is based on the distance matrix, among all possible topologies, the one with the smallest branch length sum is selected as the optimal tree. The topology of the tree is restricted by minimizing the length of the entire tree. Neighbor connected method is essentially a systematic clustering algorithm to find the optimal topology, while giving the topology of the phylogenetic tree and the lengths of the branches. Its advantages are: (i) it can construct the phylogenetic tree faster; (ii) it is suitable for analyzing larger datasets; (iii) it can be more convenient to carry out the self-expansion (bootstrap) test.
The maximum parsimony method (maximumparsimony, MP) was first developed based on the need for classification of morphological features, due to the different algorithms and there are many versions of the MP method utilizes only the features that can provide information for parsimony analysis. Generally, in DNA sequence data analysis, nucleic acid sites with sequence differences (at least 2 different types of nucleic acid sequences) are utilized, which are called parsimony informative sites. Reconstruction of a phylogenetic tree using the MP method is actually a process of comparing all possible trees for a given sequence. For a given possible tree, the nucleic acid composition of the ancestral sequences of each site is first inferred, and then the minimum number of nucleic acid substitutions used to elucidate the differences at each site is counted. The sum of the minimum number of nucleic acid substitutions at all informationally parsimonious sites in the entire tree is called the length of the tree. Compare all possible trees and select the one with the smallest length as the final systematic tree, i.e., the maximum parsimony tree.
(iii) Maximum likelihood methodThe maximum likelihood (ML) method is to assess the likelihood that the selected evolutionary model can produce the actual observed data. The method explicitly uses probabilistic models, and its goal is to find phylogenetic trees that are able to produce observed data with a high probability. When building a tree using this method, the probability of each nucleic acid substitution is considered in each set of sequence comparisons. For example, the probability of a conversion occurring is approximately 3 times that of a subversion. In a comparison of 3 sequences, if 1 column is found to have 1 C, 1 T and 1 G, it is considered that the relationship between the sequences where C and T are located is closer.
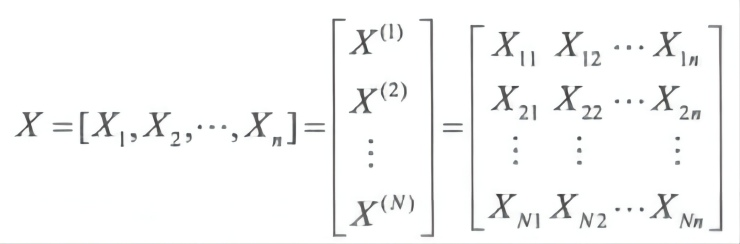
Let the number of species be N, and the length of DNA or amino acid sequences after alignment be n. The matrix formed with these sequences is
Assuming that evolution at different loci is an independent event, there are a number of different likelihood estimates that can be made based on this data matrix.
1. Calculating the likelihood of tree-building data
For a given tree, the assumptions made can be evaluated using a likelihood score, i.e., evaluating the resulting phylogenetic tree n For a given set of 1 categorical units, assuming that their observations are M as vectors), a tree can be chosen such that F(M|T) is maximized, i.e., maximum likelihood method.
Let tvn represent the branch length between nodes v and u to reflect the genetic distance or evolutionary time. The probability Px→y ( tvn ) represents the probability of transitioning from state x to state y in time-knowledge. Suppose there is a matrix which is about the actual observations of n classification units, M describing the specific values of the four features of each classification unit. Also assume that there exists a tree T whose leaf nodes (e.g., v, u) correspond to these categorization units, and the branches in the tree represent the distances tvn between the categorization units, and find the likelihood value L = P(M|T) for this tree.
2. Calculate the likelihood of the tree and its subtrees.
Let the partial likelihood ratio matrix of length n be q. Define qi = Pix (t), here, as the length of the branches. There:
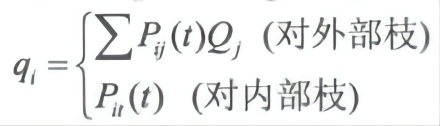
Where, Qi is the product of partial likelihood rates.
3. Calculate the likelihood ratio of the branch lengths
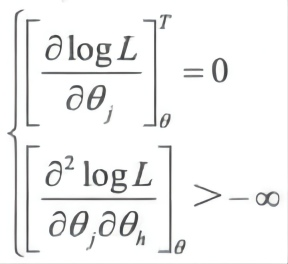
4. Estimate the maximum likelihood of θ
The maximum likelihood of θ is maximize logL(θ|X, T) θ ∈ Θ, θ satisfies
Bayesian analysis is to adopt the basic principle of maximum likelihood method, and at the same time introduce Markov chain Monte Carlo analysis, so that the tree construction time is greatly shortened compared with the ML method, and can be capable of analyzing large data sets. The method ultimately produces a gene tree, is a group of trees with similar maximum likelihood rate of the majority of the consensual tree, the tree node in this group of trees in the percentage of the node is the node of the posterior probability of the approximation, so the Bayesian method in the construction of a gene tree at the same time also gives the support rate of its nodes. Compared with previous maximum likelihood methods, the Bayesian method is superior in that it is able to handle large datasets at a high computational speed and also provides an effective parameter a posteriori probability to measure the credibility of the tree.
(E) Mrbayes software to construct phylogenetic tree operation stepsStart the Mrbayes program and enter the commands in order:
(1) Execute filename. nex, open the file to be analyzed, the file must be in the same directory with Mrbayes program.
(2) Lset nst=6 rates=invgamma, this command sets the evolution model to be a GTR model with gamma-distributed rate variation across sites and a proportion of invariable sites. The model can be changed as needed.
(3) mcmc ngen = 1 000 000 samplefreq=1 000 ensures that at least 10 000 samples are taken in the latter probability distribution (probability distribution). Default sampling frequency: every 100th generationo If the standard deviation of the split frequencies (split frequencies) is lower than 0.01 after 1 000 000 generations, when the program asks: "Continue the analysis? analysis? (yes/no)", answer no; if it is higher than 0.01, yes, continue until it is lower than 0.01.
(4) sump bumin=2,500 (in this case 10,000 samples, i.e., any value equivalent to 25% of the sampling), summarize the parameter, the program outputs a summary table of the alternative model parameters for the sample, including mean, mode, and 95% of the credibility interval of each parameter. credibility interval of each parameter, to ensure that all parameters PSRF (the potential scale reduction factor) value close to 1.0, if not close to the analysis time to be extended.
(5) sumt bumin = 2 500, summarize tree (summarize tree). The program outputs a tree with posterior probabilities for each branch, and a tree with mean branch lengths. These trees are saved in a tree file that can be read by treeview and so on.
(vi) Reliability testing of phylogenetic treesIn phylogenetic inference, certain statistical tests are often used to analyze the reliability of the obtained phylogenetic trees. One is to test the structural difference between the obtained tree and its neighboring trees by using a certain coefficient. In the ML method the likelihood value is often used, while in the minimal evolution method the total length of all branches is used. This method is a conservative test and the procedure for the test is very complex and requires a large amount of computer memory. The other is to analyze the reliability of each internal branch, in which the commonly used methods are: ① standard error estimation, that is, calculate the length of the internal branch and its standard error, test the deviation between the length of the internal branch and 0, and get a confidence probability (CP), the higher the value of CP, the more reliable the length of the branch is. Usually, when CP ≥ 0.95 or 0.99, the length of the branch can be considered statistically valid. ② bootstrap test (bootstrap test), which is a resampling technique that can be used to estimate the statistically relevant variability of the internal branch in cases where the sampling distribution is not known or difficult to analyze. The bootstrap test yields a bootstrap confidence level (BCL). Computer simulations show that when BCL > 0.9, the CP and BCL values are very similar and the results are considered reliable.
For more product details, please visit Aladdin Scientific website.